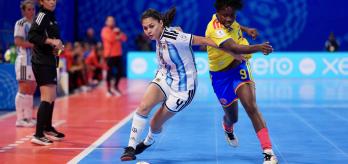
With the inaugural FIFA Futsal Women’s World Cup™ came the opportunity for the FIFA Football Performance Insights Team to apply their consistent collection framework to the new competition, helping form a deeper empirical understanding of elite women’s futsal at the international level. The following article is a summary of several findings from the collection, covering topics such as goalscoring, ball regains, substitutions and more.
The FPI stat summary
-
105 – Of the 200 goals scored from open play, 105 were scored with a first touch, highlighting the importance of first-time finishes at the elite international level.
-
100 – The average number of subs per game made by Canada – this was more than any other team.
-
33 – The average age of the Brazil squad that won the tournament. The Seleção were the oldest team at the inaugural competition.
- 2 – Teams that scored the first goal lost on only two occasions. In the remaining 30 matches, the team that went ahead went on to win.
Attacking-phase goals and consolidated leads
A total of 210 goals were scored across the 32 matches at the inaugural FIFA Futsal Women’s World Cup™, which averages at 6.6 per game. Almost a third of these goals were scored during attacking phases. These are moments in the game where a team has crossed over the halfway line with the ball (either through a ball carry or pass) and completed at least one pass inside the opposition’s half.
A high percentage of attacking-phase goals indicates that teams in possession often found themselves in situations where they had time to orchestrate a sustained attack inside the opposition’s half – typically against a low block. Tournament winners Brazil had the second-highest goal tally of any team, scoring 32 times across their six matches with an impressive 11% conversion rate. The South American side scored 13 of their goals in the attacking phase, which was more than any other team. The TSG observed that Brazil often avoided counter-attacking when regaining the ball in their own half, opting instead to build into the opposition’s half more gradually, confident in their own ability to break down low blocks. Their 13 attacking-phase goals reflect this tactical tendency.
FIFA Futsal Women’s World Cup 2025 was a tournament where the team that scored first were typically able to extend their lead. Of the 210 goals scored, 68% were scored by a team already winning. A team went on to lose a game after scoring first on only two occasions.
Possession pieces
A piece refers to a continuous period of the game during which a team is in possession of the ball; for instance, a sequence of passes leading to a shot creates a piece. A piece ends when the team loses possession (e.g. a pass goes out of play or gets intercepted by the opposition). FIFA uses pieces to determine the average passes per possession and attempts at goal per possession. Piece measurements do not account for when teams are in or against a power play, as data will be biased towards the attacking team.
Across the tournament, the average number of passes per possession was 5.7. This looks different when assessing the finalists, Portugal and Brazil, who both averaged more than 10 passes per piece. Looking at teams knocked out in the group stage, some averaged three passes or fewer per piece. Creating chances is the end goal of being in possession. In this sense, Brazil excelled, averaging one attempt at goal per possession piece, suggesting a playing philosophy that emphasises finality in attack.
High press and ball regains
As the TSG noted in their key observations, when the ball was in play, teams demonstrated diverse ways of regaining possession in the Philippines. Several participants opted to press high in zones 3 and 4 to actively turn over the ball, while others adopted a more passive approach, where they would wait in zones 1 and 2 as a compact unit until a turnover became possible.
Spain was one of these teams that demonstrated a strong ability to regain possession in open play. La Roja ranked fourth for the number of successful regains per 40 minutes, turning over possession 17.3 times on average. The bronze medallists also recorded the fastest average regain time in the tournament (4.6), performed the most high presses per match (13), and turned over possession via interception 64% of the time, rather than through blocks or tackles. These metrics construct a defensive profile based on intensity and relentlessness.
Brazil also showed a strong collective ability to turnover possession, ranking second overall for number of regains – ahead of Spain. However, the tournament winners ranked mid-table for the average number of high presses, and had a slower ball regain speed than Spain. Almost half of Brazil’s regains came through a block or tackle. These outputs reflect an approach based on more selective pressing and controlled defensive recoveries rather than immediate, constant responses. While Spain strove to press opposition high up the pitch, Brazil opted for a positional organisation that blocked key passing lanes – both approaches reaped rewards.
Kick-ins
In Manila, 28 of the 210 goals scored were a result of kick-ins taking place in the attacking half. Poland and Canada generated the highest number of these dead-ball situations per match, with 56. The hosts, the Philippines, were the most creative, generating attempts at goal from 19 of their kick-ins. However, as seen with the piece analysis above, quantity alone does not equate to success. For example, 12.5 of Brazil’s attacking kick-ins led to an attempt at goal, leaving them in the middle of the field for this metric. Yet the Seleção scored more goals from kick-in phases (10) than any other team.
Squad age and substitutions
Brazil were the oldest team at the tournament, with an average age of 33. This was six years older than the tournament average of 27 and reflected Sabóia’s desire for a team of experienced winners. The youngest team at the tournament was Tanzania, with an average age of 20.
When it comes to substitutions, there are two clear bench-management philosophies: those teams that rely on a few players and those that rotate often. Canada is the strongest advocate of the latter, averaging over 100 subs per game. Tanzania fall under the former philosophy, making 38 subs per match. Interestingly, the number of substitutions the semi-finalists made per game was relatively similar, with none of them rotating particularly heavily.
Teams varied in the number of players they introduced in their substitution slots. Panama, for example, subbed only one or two players at a time, whereas teams such as Japan and New Zealand were advocates of introducing three or four players at once. Brazil, on the other hand, ranked high for subbing two players at a time (36 times, 11% of their total sub slots).
Several teams relied on specific substitution pairings throughout the tournament. For example, Brazil’s Débora Vanin and Emilly were involved in the same substitution 31 times. Likewise, Argentina’s Lara Villalba and Silvina Nava were exchanged 24 times.