Statistically, 20% of all goals scored during this World Cup (excluding goals from penalties) were scored during attacking corner phases. This compares to 13% in 2019, the equivalent of one in eight goals that did not come from penalties. This significant increase in goals from attacking corners prompted FIFA’s Technical Study Group (TSG) to conduct an in-depth analysis to explore the reasons behind it, working together with the Football Performance Insights team.
Before we explore the findings of that analysis, it is important to explain the definitions in FIFA’s Football Language that determine how we define, collect and calculate set play data, including data for attacking corners.
How we collect and calculate set play data
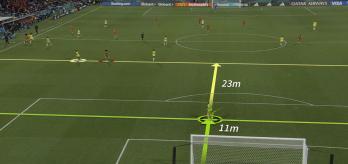
For data collection purposes, an attacking corner commences as soon as play is restarted by the corner-taker. The set play concludes when either a) the ball goes out of play or a goal is scored, or b) the attacking team’s centre-backs return to their normal positions, or c) when the opposition secures possession, whichever occurs first. As we can see in the clip below, a set play can be made up of multiple phases.
ATTEMPTS AT GOAL
Women’s World Cup 2023 saw a 7% increase in attempts at goal from set plays per 90 minutes compared to 2019, while 40.8% of corners led to an attempt at goal. In addition, a greater proportion of corners resulted in a goal in 2023, at 4.7% compared to 3.4% in 2019. This means that one goal was scored for every 21.3 corners taken in 2023, compared to one goal for every 29.6 corners in 2019.
The USA generated more attempts at goal from set plays than any other team in the competition, averaging four per 90 minutes, followed by host nation Australia with 3.9 per 90 minutes. It is worth noting that six of the top seven teams in this ranking progressed to the knockout stages.
There were 124 more corners taken in 2023 (602) than in 2019 (478). This increase can be partly explained by the fact that FIFA World Cup was expanded from 24 to 32 teams, creating additional matches. However, even after the data is normalised per 90 minutes to allow for a direct comparison with previous tournaments, there is still a significant increase. In addition, 86.6% of corners were delivered directly into the penalty area, while 13.4% were played either short or to the edge of the penalty box.
Deliveries
More goals from in-swingers
When we analysed the types of deliveries that resulted in goals and attempts at goal, it was striking to see that the number of goals scored from in-swinging corners had jumped significantly, from just two in 2019 to nine in 2023.
During the 2023 tournament, in-swinging deliveries increased by 2.1% compared to 2019, accounting for 49% of the total. By way of comparison, out-swinging corners decreased by 0.9% and driven or pushed crosses declined by 4.7%, while lofted corner kicks were up by 3.5%.
According to former Germany goalkeeper Nadine Angerer, in-swingers pose a range of different challenges for goalkeepers, depending on the height of the delivery and the area to which it is delivered:
“In-swingers are better for goalkeepers because the ball is coming to you at some point, and you need to judge the curve [i.e., the flight of the ball]. However, if they are delivered to the front post-area, it can be very difficult for a goalkeeper to get to that area, because of the position you have to start from and because you have such little time to get there, so often defenders in this area need to take the responsibility. For deliveries to the centre of the goal and back post, there is more time for the goalkeeper to adjust their position and footwork.”
Out-swinging corners leading to plenty of attempts at goal
While just 15% of all corner deliveries direct to the penalty area were out-swingers, this delivery type generated the highest percentage of immediate attempts at goal (defined as an attempt at goal that occurs in the first phase of the set piece). In fact, over half (54%) of all out-swinging corners led to an immediate attempt, an increase of 12% when compared to 2019.
As Nadine Angerer explains, out-swinging deliveries are tougher for goalkeepers to come and collect than other types of delivery:
“Because the outward nature of the curve takes the ball away from the goalkeeper, out-swingers are tougher, because goalkeepers must claim [the ball] before it bends outwards. As the ball travels in, it comes towards the goalkeeper, so they must claim it at the point at which it bends outwards or before. They also must judge the flight of the ball.
“If it is a floated or lofted, high outswinger, an attacking header could loop over the goalkeeper, so the goalkeeper must drop back if they do not manage to collect the ball before it starts to curve away. If it is a whipped, fast out-swinger, then the goalkeeper must adjust their footwork in relation to where to the first contact will occur, and these deliveries require a different skill from the goalkeeper,” she explained.
WINNING FIRST CONTACT THE KEY TO SUCCESS
Whether you are attacking or defending from a corner, winning first contact with the incoming delivery is crucial to success. When we analysed the data in this area, we saw that attacking teams achieved more first contacts on all delivery types than they did in 2019, with the notable exception of in-swingers.
Particularly given the attacking threat posed by out-swinging corners, it is significant that the percentage of first contacts from out-swingers won by the attacking team increased by 11% in 2023 as compared to 2019. The equivalent figure for driven/push corners was up 1%, while attacking first contacts from lofted corners increased by 2%. Attacking teams secured first contact 3% less often from in-swinging deliveries than at the previous tournament.
Again, Angerer gives the goalkeeper’s perspective:
“If I can’t come out, I hope my defenders get first contact and clear it well. Often goals can be conceded from the second contact or second ball following a poor first-contact defensive clearance. The location of the first contact by attackers is also relevant. If it occurs in the goal area (six-yard box), it's almost impossible to defend if it's on target. If they are in-swingers close to the goal, the attacker just needs to change the direction or trajectory of the ball with a small touch because the speed or pace is already there.”
ATTACKING THE FRONT POST
The starting positions and runs made by attacking players were also considered in our analysis. This identified the front-post area as important territory, particularly when this area was loaded with attacking players and/or players were running into the area.
For clarity, when we refer to “players attacking the front post”, we are referring to the number of attacking players in the front post zone at the point of first contact with the incoming delivery (not when the corner is taken). The figure for additional attacking players at the front post is calculated by finding the difference between the number of attacking players in the front post area when the corner was taken, and the number of attacking players in the same area at the point of first contact.
As can be seen in the graphic below, the more attacking players were located at the front post, the greater the chances were of generating an attempt at goal and of scoring. Teams that had just one player stationed around the front post area were almost twice as likely to have an attempt at goal than teams that had no players attacking that area. There was also a direct correlation between the percentage of attempts at goal that were converted (i.e., that resulted in goals) and the number of players that were located in the front-post area at the point of first contact. It is notable that when teams had three players located at the front post, 46% of corners (in phase one) resulted in an attempt at goal, with 23% of those attempts resulting in goals.
It is important to point out here that the attempts at goal included in this data were not themselves confined to the front-post area. The attempts at goal occurred in various locations, but it is the correlation between the player activity in the front post area and attempts at goal that is interesting for the purposes of this analysis. For example, sometimes teams positioned players in the front-post area as a decoy to create an opportunity to exploit space or a marking mismatch elsewhere. Loading players into the front-post zone was also an effective tactic for winning flick-ons to players elsewhere in the penalty area.
Any delivery to the front-post area poses difficulties for goalkeepers, because they have a limited amount of time to get across to the incoming ball. Loading this space with attacking players leads to additional challenges, as Nadine Angerer explains:
“If there are players loaded at the front post and there is an opposition player in front of the goalkeeper, it is very difficult for a goalkeeper to get there. Deliveries are also difficult to deal with when they come in at head height, because they are not high enough for the goalkeeper to claim them. If the delivery comes in a little bit higher, then you might be able to punch it.”
“As a goalkeeper, if you can’t get there, you don’t want your defenders in front of you blocking your view, you want them competing with the opposition to try to disturb them and reduce the quality of their shots. Having opposition players in this area often means the goalkeeper cannot see the point and moment at which the ball is released by the kick- taker, so the goalkeeper cannot move too much.”
Additional players at the front post
When we analysed the number of additional players in the front-post area (defined as the difference in the number of attacking players in the front-post area when the corner was taken and the number in the same area at the point of first contact), a similar correlation emerged: having more players in this zone for corners led to more goals. As can be seen in the graphic below, teams with two additional players in the front-post zone scored more than twice as many goals as those that had no additional players in that area.
Loading this area with attacking players and sending more runners towards the front post can bring success against both zonal and player-to-player defensive set-ups. Against zonal systems, flooding this zone with additional players can create numerical superiority for the attacking side in that specific area, and deliveries to this area can exploit that superiority. Against player-to-player marking , getting more players into this area can create mismatches between the attackers and defenders in that zone. This tactic can also be used as a decoy, bringing defending players towards the front post and thus forcing them to leave gaps elsewhere for the attacking team to exploit.
According to Angerer, runners to the front-post area can be a real problem for goalkeepers:
“As a goalkeeper, you cannot possibly compete with players running to the front post for the ball, so you rely on your defenders to track these players and compete for the ball,” she says. “However, if you can see when the ball is released, you can factor more things into your decision-making.”
In the clips below, we see a number of examples of teams using players located at the front post to generate attempts at goal and to score goals.
SUMMARY
This tournament underlined the increasing importance of set plays, and specifically of corners, in the modern game. The 32 teams at the finals employed a wide variety of tactics to make the most of their precious corner kicks, and while in-swinging corners led to more goals than other types of delivery, out-swingers were, statistically, more likely to lead to an immediate attempt on goal.
Finally, our analysis also underscores the fact that accurate delivery is important, but so too are the attacking patterns designed by teams to create goal-scoring chances from corners. Teams that attacked deliveries into the front post proved to be especially dangerous, as the second part of our set-play analysis explains.