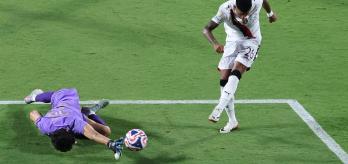
In this article, we explore some fundamental aspects of how goals were scored, how teams attempted to control the game when in possession and when out of possession, and how they used their squads across the competition, compared to the same metrics from FIFA World Cup Qatar 2022™.
In doing so, we can see the common trends that exist in the senior men’s game at club and national team level, and can gain insights into the nuanced differences of both.
Goals scored analysis
Despite one game fewer played at FIFA Club World Cup 2025, a total of 195 goals were scored in 63 games, compared to 172 goals in 64 games at the previous World Cup, representing an increase of +23 goals, with the average goals per game rising by +0.31 to 2.95. The average winning margin also increased by +0.37 to 2.21. However, it must be noted that three group-stage matches produced one scoreline with a +10 goal winning margin and two others were +6, which have impacted these numbers.
Attempts at goal on target rose from 4.3 per 30 minutes in possession (in 2022) to 5.4 in 2025, while the percentage of attempts at goal on target increased slightly (+1.2%) from 35.2% to 36.4%. The conversion of these on-target attempts at goal to goals decreased by -2.4% to 31.0%.
Of the 1,648 attempts at goal during FIFA Club World Cup 2025, 651 were from outside the area with 997 registered from inside. Notably, 92% of all goals scored in FIFA World Cup 2022 were scored from inside the penalty area but this dropped to 83% during the 2025 club competition.
Furthermore, as shown in graphic 5 below, the percentage of goals scored in all regulation time second-half sectors (45-60 minutes, 60-75 minutes and 75-90 minutes) decreased during the Club World Cup 2025 compared to the World Cup in 2022, while the percentage of goals scored in additional time at the end of both the first (45+ minutes) and second (90+ minutes) halves increased. It is also noteworthy that the percentage of goals scored earlier in the games (0-15 minutes and 15-30 minutes) increased compared to the competition in Qatar.
Squad usage and substitutions
All 32 participating clubs were able to name an initial squad of between 26 and 35 players for the new iteration of FIFA Club World Cup 2025 with many opting to reinforce their squad during the extraordinary transfer window that was open from 1 to 10 June.
On average, teams used 4.8 substitutes per game during the Club World Cup, with all five subs available being utilised at a rate of 82%. This compares to an average of 4.4 per game during the World Cup in 2022. Finalists Chelsea FC and Paris Saint-Germain only used four subs in three of their seven matches, while Inter Miami CF did not use all five in any of their four matches.
Champions Chelsea had the second youngest squad (average age of 23y4m) and used the most players (27) during the competition, including João Pedro, who signed mid-tournament. The London club also gave 53% of their playing minutes to players aged 21–25, the highest proportion of all teams in that age bracket.
Runners-up Paris Saint-Germain had the third-youngest squad (average age of 24y0m), but only utilised 19 players across their seven matches – two fewer than the tournament average of 21.1 (which was similar to the average of 21.2 average recorded in World Cup 2022).
Overall, there was a 3% decline in minutes given to 30+ year-olds to 30% of playing playing minutes, while a 3% increase was recorded in minutes played by 18–21-year-olds, which rose to 7% compared to FWC22.
With only two players over 30, and all but three under 25, FC Salzburg fielded the youngest squad with an average age of 22y8m, while 38% of their playing minutes went to players aged 18–21.
Goal contributions from substitutes
Substitutes made 63 goal contributions (39 goals and 24 assists) during the Club World Cup compared to 50 (30 goals and 20 assists) during Qatar 2022, highlighting an increase in impact. As previously noted in graphic 5 above, the number of goals scored in the second halves of games reduced slightly compared to FWC22 (with increases recorded in extra time), so substitutes were making a bigger impact in games during FCWC25.
Interestingly, Chelsea, Paris Saint-Germain and Palmeiras each recorded six goal contributions from substitutes (4 goals, 2 assists), while Manchester City FC had seven. The importance of having quality in squad depth is highlighted by the fact that, of the eight teams that reached the quarter-finals, five (PSG, CHE, SEP, BAY, FLU) contributed 4+ goals/assists from the bench.
Ball-in-play & possession control
Despite a reduction in ball-in-play time of -2m42s to 56m16s (compared to 60m26s in FWC22), the average possession sequence lengthened by +1.4s to 10.9s during FIFA Club World Cup 2025 compared to 9.5s in 2022. Manchester City (16.3s) and Paris Saint-Germain (16.2s) exceeded all average possession sequence lengths recorded in FWC22, where Spain registered the longest average at 15.3s. Notably, Auckland City FC, who registered the shortest average possession sequence length of 7.2s, matched or exceeded the averages for five FWC22 teams (AUS, CRC, IRN, KSA, TUN).
During games, teams had controlled possession of the ball for an average of 52% of the match time, down 1% from 2022, while the ball was out of play for an average of 44% of the game compared to 42% in Qatar.
As can be seen in graphics 12 and 13 below, only seven teams (MCI, PSG, INT, MSU, BAY, FLA, CHE) averaged more than 50% of the possession share in their games in possession. Both winning semi-finalists, (PSG with 63% in possession (IP) v. 31% out of possession (OOP), and Chelsea with 53% IP v. 41% OOP) averaged more in-possession share during their matches while both losing semi-finalists (Real Madrid with 46% IP v. 48% OOP and Fluminense with 43% IP v. 49% OOP) had higher out-of-possession averages than in possession.
In possession phases
When teams had possession of the ball, our data shows slight increases in more progressive attacking phases of play and slight decreases in the proportion of in-possession time spent in more passive build-up phases when compared to FIFA World Cup 2022. (See graphic 14 below)
- +3.5% in the final third (18.5%).
- +2.3% in high build-up (6.5%).
- +1.6% in progression phase (18.5%).
- -3.0% in mid/low build-up (43.7%).
CA Boca Juniors (37.1%), FC Bayern München (33%) and Manchester City (31%) registered the highest percentages of in-possession time in the final third phase, while Auckland City FC (5.2%) and Inter Miami CF (8.7%) recorded the lowest. Tournament winners Chelsea spent 30% of their in-possession time in the mid-build-up phase, with 19.3% in the progression phase and 19.7% in the final third.
FIFA’s Football Performance Insights Team now also examines the phases of play that teams play against, and this is interesting as it helps to establish why teams may dominate in certain phases (see graphics 17 and 18). For example, when Manchester City had the ball, their highest percentages of in-possession time were spent in the mid-build-up phase (34.3%) and final third phase (31%), but this makes sense as during 46% of the time they had the ball, the teams they faced retreated to a low block, and they only faced a high press 1.8% of the time.
Out of possession phases
When compared with FIFA World Cup 2022, teams from the Club World Cup spent 4.3% less of their out-of-possession time in a mid-block (20.3%) while increases were recorded in the low block phase (+3.7% to 25.2%) and the high block/high press phase (+1.1% to 10.3%). The application of direct pressure dropped by -4 to an average of 51 pressures per 30 minutes out-of-possession, while the number of indirect pressures also fell by -21 to an average of 224 (p30 OOP). This could be attributed to the difference in weather conditions with FIFA Club World Cup 2022 having been played in winter in Qatar compared to summer in the United States.
Mamelodi Sundowns FC were the highest ranked team in defensive transition with 20.2% of their out-of-possession time spent in this phase, while they were also the team that registered the highest percentage (14.8% of their OOP time) in the counter-press phase with FC Internazionale Milano (13.8%), Manchester City (13.6%) and Paris Saint-Germain (13.3%) all just behind them. They had the fourth lowest percentage of all teams in the low block phase (10.0%) with only three teams (BAY, INT and MCI) registering less.
When we analysed the phases of play that teams faced, Auckland City FC faced opponents that played in the final third for 59.2% of their out-of-possession time, forcing the New Zealanders to operate in a low block for 67.9% of their time without the ball.
Teams made more interceptions (+1.6 per 30 minutes OOP) compared to the 2022 World Cup, while Manchester City, FC Bayern München, Paris Saint-Germain and Internazionale Milano were the most effective teams at converting pressures applied in the final third to turnovers (see graphic 23).


