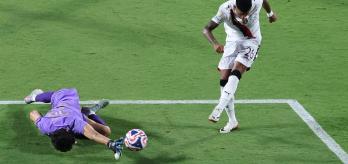
A total of 144 goals were scored in the first 48 games, with memorable finishes including – but by no means are limited to – Lautaro Martínez’s improvised overhead kick against Urawa Red Diamonds, Mohamed Ali Ben Romdhane’s curling effort against FC Porto, and Luis Suárez’s solo goal against SE Palmeiras. The highest proportion of goals was scored from positional play (49), accounting for 34.3%, but interestingly, almost a third (30.8%) of all goals scored came from set plays (44). The following article takes a deeper look at how goals in the group stage were scored, shedding light on intriguing tactical topics for future observation.
Counter-attacks
A total of 17 goals were scored from counter-attacks during the opening 48 games of FIFA Club World Cup 2025, compared to 11 at the same stage of FIFA World Cup 2022. However, there were more counter-attacks in Qatar (456) in the group stages than in the USA (433). A deeper dive into the data reveals that, despite there being fewer counter-attacks during the Club World Cup group stage, there were more attempts at goal (+11) and more goals scored (+6) than in the most recent World Cup, showing a greater efficiency from teams in this attacking phase.
Jürgen Klinsmann, a member of the Technical Study Group observing the FIFA Club World Cup, hints that the subtle increase in efficiency could be due to more fundamental differences between club and international football.
“The difference between a Club World Cup and a World Cup is that in the former, a team’s [tactical] automations are much more established. With national teams, this isn’t possible because of time constraints. Clubs can be more fluid because they’ve been doing it throughout the season.”
Corners
It was noted that set plays accounted for 44 of the goals scored in the Club World Cup group stage, which was the second largest portion of goals scored, behind positional play. Corners contributed the most to this category, with a total of 18 goals in the US group stage coming from these dead-ball situations (as opposed to 15 in Qatar 2022). The percentage of corners ending in a goal in the 2025 competition was 4.0% – a noticeable shift from the 2.6% registered in 2022. Additionally, 41.4% of corners ended in an attempt in the more recent tournament compared to the 31.3% seen in 2022.
The increased efficiency from these dead-ball situations is further visible when sorting them into direct and non-direct corners. One of the more striking changes is that 41.0% of non-direct corners in the US tournament’s group stage resulted in an attempt at goal, which was a 16% increase from the 25.0% recorded at the same stage of the competition in the World Cup.
An increase in efficiency was also seen in direct corners. At the Club World Cup, the first contact resulted in an attempt on goal in one in four direct corners; at the 2022 World Cup, attempts on goal in these situations were slightly less frequent, with one in five. Figure 9 shows the top 10 teams for the average number of attempts generated per direct corner in the US. The array of clubs in the top 10 is particularly interesting, with the AFC, Concacaf, CONMEBOL and UEFA all represented.
Full-backs
The highest number of positional-play goals at the FIFA Club World Cup group stage came from penetration through wide areas. Figures 11 and 12 show full-backs were also receiving and playing a higher proportion of their passes in the inside channels when compared to the same stage at the Qatar tournament, with their contributions on the ball in the wide channels declining as a result. For example, the portion of passes from full-backs originating in the left wide channel has decreased from 41.0% in the 2022 competition to 36.2% in the US, whereas the percentage of passes made by the same playing position in the inside-left channel has increased from 12.2% to 15.4%. A similar pattern is visible on the outer two channels on the right side of the pitch.
The way full-backs contribute to their team’s in-possession play is to be monitored further, but the shift in the data could reflect the increased fluidity of playing positions, with central players rotating to the outer channels and wide players drifting more central; this latter point is also reflected in the average distance full-backs are from the sidelines, presented in figure 13. Compared to the Qatar group stages, players in this role in the US are, on average, 1.1 metres narrower.


